
Page 16 - Grindaix_Condition_Monitoring_en
P. 16
ITEM NO.: GRX-SOFTWARE
THE MONITORING DASHBOARD
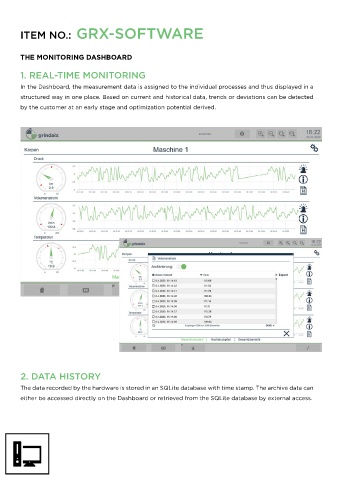
1. REAL-TIME MONITORING 3. LIMIT VALUE-DEPENDENT MONITORING
In the Dashboard, the measurement data is assigned to the individual processes and thus displayed in a In addition to the well-structured data display, limit values for warnings and alarms can be set via the
structured way in one place. Based on current and historical data, trends or deviations can be detected Dashboard. The digital inputs of the Grindaix hardware can be used to record different process states and to
by the customer at an early stage and optimization potential derived. individually define limit values for each sensor/measurement value and for each process state. A response
to a limit value violation can be sent via the digital outputs of the hardware, e.g. to a signal lamp or to the
control system of the monitored process. In this way, automatic monitoring with low latency is achieved,
offering the possibility to perform fast data analysis, to proactively derive measures, and to avoid errors.
2. DATA HISTORY 4. VIRTUAL REPRESENTATION
The data recorded by the hardware is stored in an SQLite database with time stamp. The archive data can OF THE PRODUCTION ENVIRONMENT
either be accessed directly on the Dashboard or retrieved from the SQLite database by external access.
The customer-specific Dashboard provides a virtual representation of your production environment,
ensuring that the process data is displayed in an intuitive and transparent way.